'Warm blob' of water in Pacific Ocean could hurt salmon

Shows that the computer programs have a long way to go in estimations.
Man has a lot to learn about the oceans, fish and a lot of other things.
Man using computers has a poor record in estimating what might happen.


http://www.bellinghamherald.com/news/local/article34975239.html
Fraser River pink salmon run a poor haul for U.S. fishermen
"...the Pacific Salmon Commission preseason forecast of 14.4 million. That estimate was based on the abundance of fry that went into the ocean two years ago.

Then during the season, the commission downgraded the run size to 6.2 million pinks.

But the number of pinks caught in U.S. waters by commercial fishermen was only about 640,100, according to Sept. 11 data from the Pacific Salmon Commission...
"
 
Last edited by a moderator:
Thought you were a science guy?
Sure not going with that are you?
Keep on being non scientifical.

I'm not interested in debating you on your nonsense.
Sure I'm not a scientist but I have two eyes that can see what is going on and a brain to tell the difference between right and wrong. I also have two hands and free will to do something about it. So if you have something new to share, then please do or else drop it. Your time has passed and it's now up to others to clean up and repair the damage.
 
Shows that the computer programs have a long way to go in estimations. Man has a lot to learn about the oceans, fish and a lot of other things. Man using computers has a poor record in estimating what might happen.

It's not just the "computers", OBD:

agentaqua 05-11-2015, 02:38 AM post #70 http://www.sportfishingbc.com/forum...ater-in-Pacific-Ocean-could-hurt-salmon/page7
You're missing the point 3x5. It's not a shell game. If "we" get "Southern Fish" - it means - NO FISH - at least for this outmigrating year that has to deal with the blob and the implications around food quantity, quality - and predators.

agentaqua 05-11-2015, 02:38 AM post #74
http://www.sportfishingbc.com/forum...ater-in-Pacific-Ocean-could-hurt-salmon/page8
no -as I said - for this year's outmigrating juvenile salmon - if the temperatures exceed something like 7C for an extended period. The ocean survival rates drop to near zero. You need ocean survival rates to meet or exceed some 2-3% just to maintain a population, more like 5-7% in order for that run to thrive.

agentaqua Yesterday, 07:50 PM post #199
http://www.bellinghamherald.com/news/local/article34975239.html
Fraser River pink salmon run a poor haul for U.S. fishermen
"...the Pacific Salmon Commission preseason forecast of 14.4 million. That estimate was based on the abundance of fry that went into the ocean two years ago.

Then during the season, the commission downgraded the run size to 6.2 million pinks.

But the number of pinks caught in U.S. waters by commercial fishermen was only about 640,100, according to Sept. 11 data from the Pacific Salmon Commission...
"
Do you understand what I was saying from before on this thread??
 
Last edited by a moderator:
Tropical Pacific Ocean Warms While Atmosphere And Other Oceans Don't

According to the National Oceanic and Atmospheric Administration (NOAA), the preeminent ocean temperature measuring buoy system named “ARGO,” is helping oceanographers and climate scientists answer one of the most important climate question of the decade. Why has the Pacific Ocean dramatically warmed during the last 12 months when the atmosphere hasn’t warmed in 18 years 8 months?
A very important question to be sure. However, sometimes asking the proper question is more important than the answer, because properly formulated questions often lead to amazing new insights. As an example, climate scientists, politicians, and the public should actually be asking this question: Why has the tropical Pacific Ocean dramatically warmed during the last 12 months when the atmosphere and all other oceans haven’t warmed?
Lost in the rush to judge whether the currently warming Pacific Ocean and associated 2015 El Niño is atmospherically or naturally induced, many people have neglected to properly consider one other hugely important factor. None of Earth’s other oceans are warming. This is a very telling piece of information. It strengthens the likelihood that current Pacific Ocean warming is related to natural deep ocean geological forces and not man-made atmospheric warming. This article will discuss how one dataset, specifically the ARGO ocean buoy system measurements, support this contention.
The ARGO buoy system is modern, sophisticated, and very precise. It is a network of 3,881 GPS-monitored, independently operating buoys that act autonomously to vary their depth from surface to 6,000 feet while continuously recording ocean temperatures and pressures. The data is remotely sent in real time to a central computer. A quick glance at a distribution map of the worldwide position of these buoys is quite impressive (Figure 1). Wow that’s a lot of buoys!
Many universities and government agencies that have used the ARGO data to map, study, and computer model ocean temperature variations, including those associated with the emerging 2015 Pacific Ocean El Niño. The results of all this research has been presented in the media as smartly packaged scientific write-ups. Typically, these write-ups contain a very well-written storyline accompanied by colorful, precise, and supposedly definitive / “smoking gun” ARGO temperature maps.
The storyline is that the ARGO temperature maps have helped identify the hiding place of nearly twenty years of global man-made global warming, a limited geographical and ocean depth portion of the far western Pacific Ocean. Climate scientists provide the following explanation of how this 18.7 year hiding process worked:
Heat energy from years of man-made atmospheric warming from every region of Earth has somehow been continuously captured and concentrated.
Concurrently the energy has been transported from every atmospheric region on earth by an unknown process to a limited geographical portion of the western Pacific Ocean where it has resided at a constant ocean depth interval of 900-1,800 feet for 18.7 years.
Finally, for reasons not well understood, this energy / heat stock pile has decided it’s now time to move east and fuel the 2015 El Niño.
This man-made global warming explanation lacks credibility for many reasons as documented in several previous CCD write-ups. This article will address one additional reason, misinterpretation of the ARGO buoy system dataset temperatures.
Let’s start by taking a different look at the geographical distribution of ARGO buoys, a more rigorous mathematical look. The oceans cover 139,700,000 square miles of earth and there are 3,881 buoys. This equates to one buoy every 36,000 square miles. That doesn’t sound like a lot because it isn’t. Then it gets worse.
The oceans can be divided into three district depth ranges; shallow, mid-level and deep. So there are therefore three times 139.7 million square miles of area to measure with 3,881 buoys. This equates to 108,000 square miles per buoy. Lastly, many deep-ocean geological heat and fluid sources are…well deep. Most, but not all, are located at depths greater than 6,000 feet which is beneath the ARGO Buoy depth capability.
Given these ARGO depth and spacing restrictions it’s easy to understand why climate scientists attempting to locate heat flow sources for the warming Pacific Ocean have never considered geological point sources. They can’t directly measure / image their temperature fingerprint. Stated another way typical fixed limited-area geological heat sources are at depths greater than 6,000 feet and occupy an area less than 10,000 square miles (100 x 100 miles), making it difficult to directly measure their affect.
However there is a very reliable way to use the ARGO data to discern the indirect affect of the smaller and deeper geological heat areas. The ARGO buoy system data does clearly show the smeared “effect” of a deep-ocean limited-area geological heat point sources in the shallow Sea Surface Temperature (SST) maps (Figure 2.). As the heat from a geological point source is moved laterally and dispersed outward and upward by ocean current, the heat signature will appear as a well-defined cone-shaped anomaly that points back to the region of the deep geological heat point source (Figure 2.). Realizing that this pattern represents a deep-fixed geological heat point source has not been given proper consideration by atmospherically biased climate scientists. You can never see what you are not looking for.
Figure 2) April 2015 Pacific Ocean Shallow Sea Surface (SST) temperature map. Anomalously warmed areas are shown in dark red and orange. Regional shallow sea surface current flow of the Pacific Ocean is from west to east. The location of the anomalously warm temperatures is a small deep ocean area east of New Guinea and is marked as the “Heat Point Source” on the map.
Importantly, current ARGO maps of the remaining oceans does not show significant temperature variations / patterns that compare in magnitude or intensity to the Pacific Ocean anomaly. Why? If the atmosphere is warming as contended by climate scientists advocating the theory of global warming, wouldn’t some of that atmospheric heat energy hide in another ocean? If so, it’s doing a very good job hiding, because it does not show up on any ARGO generated SST maps. The absence of significant heating anomalies in other oceans is taken here as yet another piece of solid evidence that the 2015 Pacific Ocean El Niño is geological in nature.
Truly understanding the vastness of the world’s oceans is difficult to conceive, especially in an era of high tech communication, over-population, and the ease of worldwide travel. There is actually more dry land on the surface of our moon than there is on our planet. All of us incorrectly assume that every inch of earth has been explored, mapped, and defined. It hasn’t.
The world’s oceans are like another planet. Only 1% of the oceans have been properly explored and viewed with human eyes. It should come as no surprise that the forces controlling the oceans are virtually unknown. Sure, we get remote sensing glimpses of these forces now and then, but a clear view…no way! This includes the ARGO buoy dataset.
The Pacific Ocean is warming, but the atmosphere and all other oceans are not. Why? The answer has been hidden from view by our inability to consider non-atmospheric heat sources.
James Edward Kamis is a Geologist and AAPG member of 41 years and who has always been fascinated by the connection between Geology and Climate. Years of research / observation have convinced him that the Earth’s Heat Flow Engine, which drives the outer crustal plates, is also an important driver of the Earth’s climate.
REFERNCES
http://www.argo.ucsd.edu/How_Argo_floats.html
https://en.wikipedia.org/wiki/Argo_(oceanography)
 
Pacific Ocean "blob" fed massive toxic algae bloom
AP September 30, 2016, 4:41 PM
ap-16274000264725.jpg

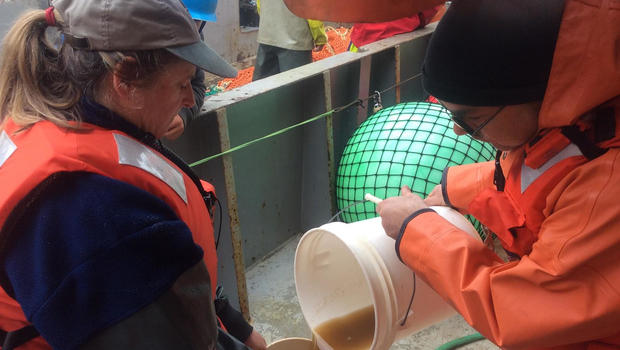
NOAA researchers pour a sample of sea water containing a brownish toxic algae into a jar aboard a research vessel off the Washington Coast.

NOAA Fisheries via AP

SEATTLE A new study finds that unusually warm Pacific Ocean temperatures helped cause a massive bloom of toxic algae last year that closed lucrative fisheries from California to British Columbia and disrupted marine life from seabirds to sea lions.

Scientists linked the large patch of warm ocean water, nicknamed the “blob,”to the vast ribbon of toxic algae that flourished in 2015 and produced record-breaking levels of a neurotoxin that is harmful to people, fish and marine life.


Could "the blob" end California's drought?

The outbreak of the toxin domoic acid, the largest ever recorded on the West Coast, closed razor clam seasons in Washington and Oregon and delayed lucrative Dungeness crab fisheries along the coast. High levels were also detected in many stranded marine mammals.

“We’re not surprised now having looked at the data, but our study is the first to demonstrate that linkage,” said Ryan McCabe, lead author and a research scientist at the University of Washington’s Joint Institute for the Study of the Atmosphere and Ocean. “It’s the first question that everyone was asking.”

McCabe and his co-authors explain how the toxic algae bloom thrived in their study published in the journal Geophysical Research Letters.

Seasonal algae blooms are common each year along the West Coast, but most are not toxic. The scientists found that the algae bloom was dominated by a single species called “Pseudo-nitzschia australis” that is highly toxic.

The algae survived and took advantage of warm, nutrient-poor conditions set up by the patch of water that was warmer at the surface than normal.

Coastal upwelling last spring - a seasonal event that brings nutrient-rich, cooler waters up from the deep ocean - provided nutrients for the algae to bloom into a large population fairly quickly at sea. Finally, a series of late spring storms delivered the bloom to the coast.

“While temperature isn’t everything, it’s serving as a decent proxy,” said McCabe. “We think there’s a linkage between toxic events along our coast and climate variability indices.”


Scientists eye global warming's role in severe storms

The blob was a one-time event that was not due to global warming, “but we are looking at this event as a potential window into the future as what conditions could look like,” McCabe said.

Kathi Lefebvre, a co-author and marine biologist at NOAA’s Northwest Fisheries Science Center, said the bloom resulted in the highest levels of domoic acid contamination in the food web ever recorded for many species.

Domoic acid accumulates in anchovies, sardines and other small fish as well as shellfish that eat the algae.

Marine mammals and fish-eating birds in turn can get sick from eating the contaminated fish. In people, it can trigger amnesic shellfish poisoning, which can cause permanent loss of short-term memory in severe cases.

Sea lions in California commonly experienced seizures, a common sign of domoic acid poisoning, during harmful algae blooms along that state’s coast. But 2015 was the first year that such harmful effects were documented as far north as Washington state, scientists said.

“This is an eye-opener for what the future may hold as ocean conditions continue to warm globally,” Lefebvre said.
 
Published on Apr 29, 2016
During the winter of 2014/2015, surface ocean temperatures in the Subarctic Pacific were the highest ever recorded in over 60 years of observations. This mass of warm water, which came to be known as ‘the blob’, spread towards coastal British Columbia and had a significant impact on regional climate, and the lives of millions of people. In this talk, Prof. Philippe Tortell describes the basic oceanographic and atmospheric conditions that led to the formation of the blob, and its effects on everything from winter ski conditions, salmon returns to the Fraser River, forest fires and toxic algal blooms. He argues that the blob may be a crystal ball into a future, warmer climate.
 
A Striking New View of the Pacific “Blob”

To better understand the strange mass of warm water that appeared from 2013 to 2016, scientists are mapping it from space.
View Images
This map shows anomalously high sea-surface temperatures in the Pacific Ocean in May 2015 as compared to the 2002–2012 average. The recent warm-water phenomenon is known as “the Blob.”


Map by American Geophysical Union
By Betsy Mason
PUBLISHED February 8, 2017
http://news.nationalgeographic.com/2017/02/space-map-pacific-blob/
 
Back
Top