Climate: LNG in B.C. vs Alberta tarsands

Status
Not open for further replies.
Originally Posted by OldBlackDog

Before I go any further with this, let me be very clear that neither I nor anyone I know doubts that climate changes. This has been going on throughout our planet’s history — beginning long before the Industrial Revolution introduced smokestacks and SUVs.
He is author of “Climate of Corruption: Politics and Power
quote_icon.png
Behind the Global Warming Hoax,”


What nonsense ... typical from the climate change denial half wits.
http://www.desmogblog.com/larry-bell pal of Fred Singer....

bullshit_detector4.gif

"...climate change denial half wits." So any one who disagrees with you in any way is a half wit, in your opinion? I think this thread has reached the end of its run, in MY opinion.

Any one that thinks the climate change is a hoax and writes a book about it is a half wit and I'll stand by that statement.
There is not one scientific establishment in the world that rejects the consensus of the fact that man-made climate change is real and it's a serious problem.
http://en.wikipedia.org/wiki/Scientific_opinion_on_climate_change

With that evidence what would you suggest a better term for someone that thinks it's a hoax should be called. I prefer to call a spade a spade but am open to your thoughts.
 
Last edited by a moderator:
What nonsense ... typical from the climate change denial half wits.
http://www.desmogblog.com/larry-bell pal of Fred Singer....

bullshit_detector4.gif

Oh, no. I don't think we're done here.

More and more scientific "half-wits" (or any number of ad hominems from GLG) are coming forward with discoveries that question the alarmist position.

For instance: A Basic Model of the Greenhouse Effect with Climate Sensitivity=0.2 C
http://claesjohnson.blogspot.ca/2015/03/a-basic-model-of-greenhouse-effect-with.html

View attachment 16668

Yes Claes Johnson co authored the book "Slaying the Sky Dragon - Death of Greenhouse Gas Theroy" another book challenging the theory and exposing the climate change hoax..... that would make him a half wit also.

Here is a review from Amazon...
http://www.amazon.com/review/R554OC...D=133140011&store=digital-text#wasThisHelpful

As a physicist, I became so alarmed when I read a few chapters of this book available free online that I went to the website blog and engaged in a discussion with two of the books authors. Alas, this discussion did nothing but confirm my suspicions about this book and the authors. The arguments made in this book are so far out there that even well-known anthropogenic global warming (AGW) skeptics like Richard Lindzen, Roy Spencer, and Lord Monckton have apparently tried to distance themselves from its arguments. When there is an argument against AGW so bad that even Lord Monckton won't embrace it, that's saying something!

The two chapters that I have read online, written by Claes Johnson, seem to adopt an interesting "strategy" (whether it is a conscious choice or not, since it is hard to tell whether or not the author is deluding himself along with his audience). He presents a lot of mathematics almost sure to go over the heads of most of the readers of the book, but interspersed with some simplistic conclusions and analogies related to AGW that don't follow from the mathematics that he has presented. Thus, the reader who wants to believe these conclusions is left thinking, "See...Here is someone who has shown mathematically what I have suspected all along!" Alas, they don't realize that they are simply being duped.

One example of those who have unfortunately been duped is the reviewer here who states: "The global warming mechanism of carbon dioxide infrared radiation is impossible because heat can not flow from a cooler area (the atmosphere) to a warmer area (the earth surface). If this impossibility was the case it would violate the Clausius statement of the Second Law of Thermodynamics." I teach thermodynamics and have published many papers in top physics journals in the field of statistical physics, which provides the underpinning of thermodynamics, and I can state categorically that this claim is utterly wrong. In all models of the greenhouse effect, be they toy models that one can work out on the back of an envelope or full-blown climate models that occupy the world's fastest supercomputers, the flow of heat is from the earth's (warmer) surface to the (colder) atmosphere as the 2nd Law requires. In fact, the equations of radiative transfer are formulated in a way that there is never a violation of the Second Law if they are correctly applied.

The role of increasing greenhouse gases is simply to reduce the amount of radiation that the earth sends back out into space for a given surface temperature, thus requiring the surface to warm in order to restore the radiative balance of the earth. It is really no more mysterious than a person putting on a coat rather than going out naked when the temperature is 40 below zero in order to prevent themselves from getting hypothermia!

It is sad that some people with scientific and mathematical backgrounds who should know better have such strong ideological biases that they are led to write such pseudoscientific nonsense as this book.
 
Oh, no. I don't think we're done here.


View attachment 16668

Perhaps you should read what Judith Curry wrote.

So, if you have followed the Climate Etc. threads, the numerous threads on this topic at Scienceofdoom, and read Pierrehumbert’s article, is anyone still unconvinced about the Tyndall gas effect and its role in maintaining planetary temperatures? I’ve read Slaying the Sky Dragon and originally intended a rubuttal, but it would be too overwhelming to attempt this and probably pointless.
http://judithcurry.com/2011/01/31/slaying-a-greenhouse-dragon/

There you go even the true climate skeptics think this is hog wash from the climate deniers.
 
The Past Keeps Getting Cooler

By Paul Homewood

h/t Eliza

Corn-belt-JJA-temperature-precip-1895-2013-diff-in-datasets

Roy Spencer has spotted another example of how the past keeps getting miraculously cooler.

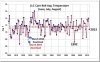
I was updating a U.S. Corn Belt summer temperature and precipitation dataset from the NCDC website, and all of a sudden the no-warming-trend-since-1900 turned into a significant warming trend. (Clarification: the new warming trend for 1900-2013 is still not significantly different from zero at the 90% confidence level. H/T, Pat Michaels)

As can be seen in the following chart, the largest adjustments were to earlier years in the dataset, which were made colder. The change in the linear trend goes from 0.2 deg F/century to 0.6 deg. F/century.


Corn-belt-JJA-temperature-precip-1895-2013-diff-in-datasets

I know others have commented on the tendency of thermometer data adjustments by NOAA always leading to greater warming.

As Dick Lindzen has noted, it seems highly improbable that successive revisions to the very same data would lead to ever greater warming trends. Being the co-developer of a climate dataset (UAH satellite temperatures) I understand the need to make adjustments for known errors in the data…when you can quantitatively demonstrate an error exists.

But a variety of errors in data measurement and collection would typically have both positive and negative signs. For example, orbit decay causes a spurious cooling trend in the satellite lower tropospheric temperatures (discovered by RSS), while the instrument body temperature effect causes a spurious warming trend (discovered by us). The two effects approximately cancel out over the long term, but we (and RSS) make corrections for them anyway since they affect different years differently.

Also, the drift in satellite local observation time associated with orbit decay causes spurious cooling in the 1:30 satellites, but spurious warming in the 7:30 satellites. Again this shows that a variety of errors typically have positive and negative signs.

In contrast, the thermometer data apparently need to be adjusted in such a way that almost always leads to greater and greater warming trends.

How odd.

http://www.drroyspencer.com/2015/03/even-though-warming-has-stopped-it-keeps-getting-worse/

There is a bit of armwaving in the comments, telling us it is all down to TOBS and how we should pay attention to Zeke. However, as Roy makes clear, the adjustment of 0.4F/C,that he has discovered, is just the change since the chart was run a year ago, which, of course, already included adjustments for TOBS and the like.

( This is confirmed by NCDC in their Readme for the nClimdiv dataset, which includes these adjustments, and which was introduced last March).

So these latest changes are adjustments to already adjusted data.
 

Attachments

  • image.jpg
    image.jpg
    70.7 KB · Views: 17
  • image.jpg
    image.jpg
    52.2 KB · Views: 17
Whoops! Study shows huge basic errors found in CMIP5 climate models

Earth’s_Energy_Budget_Incoming_Solar_Radiation_NASA
Incoming solar radiation at the Top of the Atmosphere (TOA)

It was just yesterday that we highlighted this unrealistic claim from CMIP5 models: Laughable modeling study claims: in the middle of ‘the pause’, ‘climate is starting to change faster’. Now it seems that there is a major flaw in how the CMIP5 models treat incoming solar radiation, causing up to 30 Watts per square meter of spurious variations. To give you an idea of just how much of an error that is, the radiative forcing claimed to exist from carbon dioxide increases is said to be about 1.68 watts per square meter, a value about 18 times smaller than the error in the CMIP5 models!

The HockeySchtick writes:

New paper finds large calculation errors of solar radiation at the top of the atmosphere in climate models

A new paper published in Geophysical Research Letters finds astonishingly large errors in the most widely used ‘state of the art’ climate models due to incorrect calculation of solar radiation and the solar zenith angle at the top of the atmosphere.

According to the authors,

Annual incident solar radiation at the top of atmosphere (TOA) should be independent of longitudes. However, in many Coupled Model Intercomparison Project phase 5 (CMIP5) models, we find that the incident radiation exhibited zonal oscillations, with up to 30 W/m2 of spurious variations. This feature can affect the interpretation of regional climate and diurnal variation of CMIP5 results.

The alleged radiative forcing from all man-made CO2 generated since 1750 is claimed by the IPCC to be 1.68 W/m2. By way of comparison, the up to 30 W/m2 of “spurious variations” from incorrect calculation of solar zenith angle discovered by the authors is up to 18 times larger than the total alleged CO2 forcing since 1750.
radiative-forcing-components

Why wasn’t this astonishing, large error of basic astrophysical calculations caught billions of dollars ago, and how much has this error affected the results of all modeling studies in the past?

The paper adds to hundreds of others demonstrating major errors of basic physics inherent in the so-called ‘state of the art’ climate models, including violations of the second law of thermodynamics. In addition, even if the “parameterizations” (a fancy word for fudge factors) in the models were correct (and they are not), the grid size resolution of the models would have to be 1mm or less to properly simulate turbulent interactions and climate (the IPCC uses grid sizes of 50-100 kilometers, 6 orders of magnitude larger). As Dr. Chris Essex points out, a supercomputer would require longer than the age of the universe to run a single 10 year climate simulation at the required 1mm grid scale necessary to properly model the physics of climate.

The paper: On the Incident Solar Radiation in CMIP5 Models

Linjiong Zhou, Minghua Zhang, Qing Bao, and Yimin Liu1

Annual incident solar radiation at the top of atmosphere (TOA) should be independent of longitudes. However, in many Coupled Model Intercomparison Project phase 5 (CMIP5) models, we find that the incident radiation exhibited zonal oscillations, with up to 30 W/m2 of spurious variations. This feature can affect the interpretation of regional climate and diurnal variation of CMIP5 results. This oscillation is also found in the Community Earth System Model (CESM). We show that this feature is caused by temporal sampling errors in the calculation of the solar zenith angle. The sampling error can cause zonal oscillations of surface clear-sky net shortwave radiation of about 3 W/m2 when an hourly radiation time step is used, and 24 W/m2 when a 3-hour radiation time step is used.
 

Attachments

  • image.jpg
    image.jpg
    56.5 KB · Views: 15
  • image.jpg
    image.jpg
    68.5 KB · Views: 30
**** genus: In Ethiopia, researchers have discovered the 2.8 million year-old jawbone of a skull now thought to be evidence of the first human from the **** genus. Of the some 20 species in the **** genus, the only one surviving is **** sapiens, which evolved in the Tropics. Yet, government bureaucrats and some government funded scientists insist that warming will harm the health of **** sapiens? See link under Questioning the Orthodoxy, though the report does not ask the question.
 
There is not one scientific establishment in the world that rejects the consensus of the fact that man-made climate change is real and it's a serious problem.
http://en.wikipedia.org/wiki/Scientific_opinion_on_climate_change

"97% of climate scientists have concluded that human-caused climate change is happening.
And here is the proof http://iopscience.iop.org/1748-9326/8/2/024024/

What do you want for your children?"

A Wikipedia entry pushing a cooked consensus, followed by a, "Think of the Children!"?

If an argument from authority was what I was looking for I'd join the Catholic Church.

I hear 97% of priests believe in God.

So CK you know of a science institution that has come forward and said that man-made climate change is false and that it is not a serious problem? Why don't you let us know so we can see. If not your just blowing smoke with your argument or in Latin argumenttes smokess assess
 
Last edited by a moderator:
The Past Keeps Getting Cooler

By Paul Homewood


How odd..

Well there you go ... should it now be Global Corning or are you still predicting Global Cooling
 
Last edited by a moderator:
Whoops! Study shows huge basic errors found in CMIP5 climate models

attachment.php
You have no idea what this means except the first line in the climate change denial website you copy pasted this from. Sad....
Have a look at that graph you posted.... It sure blows your pet theory away..... LOL
You just scored another goal on your own team.
 
Last edited by a moderator:
[a8NHoZiPFH4]https://www.youtube.com/watch?v=a8NHoZiPFH4
 
So CK you know of a science institution that has come forward and said that man-made climate change is false and that it is not a serious problem? Why don't you let us know so we can see. If not your just blowing smoke with your argument or in Latin argumenttes smokess assess

Do you mean a "science institution" funded by taxpayer money, or those conducting science under other funding arrangements such as private universities or other groups?

I think you will find that most government money produces a similar message, and alternatively, those without the need for public grants and those who may be looking at the issue as a purely scientific endeavour may provide a much different take.

But, you know this already, and will inevitably claim that government monies are pure - and everything else is tainted by the evil petro-empire.

That being said, I think I am done here.
 
Is Arctic Sea Ice Heading for a New Low?

March 9, 2015

http://climatecrocks.com/2015/03/09/is-arctic-sea-ice-heading-for-a-new-low/#more-22953

ijis_extent.jpg

In the past decade, we’ve seen two very dramatic collapses in arctic sea ice, 2007, and 2012. 2007 amounted to a ‘perfect storm” in terms of the various chaotic factors that came together to sweep away large swaths of ice cover. 2012 was a year most notable for not being notable – yet the ice still collapsed.
2013 and 13 saw what passes on Fox New for a “recovery” – we didn’t set new low records.
But now, ice watchers have started remarking on the set-up as we go into a new melt season. In this El Nino year (like 2007), could we be seeing another low record in the making?

Below, Bob Henson has taken over Jeff Master’s blogging chores at WeatherUnderground, and is tearing it up. I’m going to be reposting a lot of his stuff.
Bob Henson in Weather Underground:
Instead of easing toward its typical March maximum in coverage, the Arctic’s sea ice appears to be more inclined toward getting a head start on its yearly summer melt-out. As of Sunday, March 8, Arctic sea ice as calculated by Japan’s National Institute of Polar Research extended across 13.65 million square kilometers (Figure 1, red line). This value is more than 450,000 sq km–roughly the size of California–below the record extent for the date.
Even more striking is the consistency of the ice loss over the last couple of weeks. March is often a time of rapid gains and losses in ice cover, as seasonal warming and melting battle it out with quick refreezing when shots of cold air return. This year, the ice extent peaked on February 15 at 13.94 million sq km, and it looks increasingly unlikely that the ice will manage to return to that very early peak over the next couple of weeks. No season in the Japanese database has fallen short of the 14-million mark, so if the February peak stands, it will mark the lowest maximum in the Arctic since satellite monitoring began in 1979.
Using a slightly different formula for calculating extent, the National Snow and Ice Data Center comes up with a similar record low for the date (Figure 2). In an update on March 4, NSIDC stated: “The Arctic maximum is expected to occur in the next two or three weeks. Previous years have seen a surge in Arctic ice extent during March (e.g., in 2012, 2014). However, if the current pattern of below-average extent continues, Arctic sea ice extent may set a new lowest winter maximum.” (As explained by NSIDC, “extent” measures the outer edge of where ice covers most of the ocean surface, with at least 15 percent of ice coverage required in a given grid cell. It’s a bit like measuring the size of a slice of Swiss cheese. “Area” is a more direct index of where ice actually exists–the cheese itself–but it’s also more prone to difficulty in satellite measurement.)
nsidc_3.8.15.jpg

Not only is Arctic sea ice essential to many ecosystems: it serves as a powerful tracer of recent warming, and its absence in summer allows open water to absorb much more heat from sunlight. While the ice has seen some modest recovery in recent years, it has failed to fully mend the fabric torn by the record-setting drop of 2007. The overall thickness of the ice, and the fraction that’s survived for multiple years (multiyear ice), have both suffered major losses. A comprehensive survey just published in The Cryosphere found that ice thickness in the central Arctic dropped by 65 percent from 1975 to 2012.
Discover:
In the ten days between February 25th and March 7th, swaths of sea ice floating across an area of the Arctic the size of Washington state simply vanished.
This sharp drop in Arctic sea ice, following on from a particularly low extent in February, may be a harbinger of a new record: the lowest maximum winter extent for Arctic sea ice in the satellite era.
Each year at the end of the warm season, falling temperatures cause ice to form atop Arctic waters and spread ever more widely during winter. The geographic extent of this ice typically reaches a maximum in the first or second week of March. After that, warming temperatures inexorably cause it to shrink until a minimum is reached, typically in September.
Thanks to human-caused global warming — which has affected the Arctic strongly — both the maximum winter extent of sea ice, and the minimum extent at the end of the warm season, have been getting smaller and smaller over the years.
February saw the third lowest extent of Arctic sea ice for the month. On February 25th, the ice actually stopped growing and began shrinking — two or three weeks before the long-term average peak. (Click on the thumbnail image at right for the details.)
In fact, between the 25th and March 7th, sea ice coverage shrank by 175,000 square kilometers, or 67,568 square miles. That’s slightly smaller than Washington state.
One caveat is in order: In 2012, and 2014, Arctic sea ice rallied during much of March, growing in extent past the usual peak. And it’s entirely possible that this will happen over the next few weeks. We’ll just have to wait and see.

nsidc092015.jpg

Below, my 2012 sea ice video – chronicling the last stunning sea ice drop, visible as the right-most negative spike on the graph above.
[ZYaubXBfVqo]https://www.youtube.com/watch?v=ZYaubXBfVqo&t=378
 
Do you mean a "science institution" funded by taxpayer money, or those conducting science under other funding arrangements such as private universities or other groups?

I think you will find that most government money produces a similar message, and alternatively, those without the need for public grants and those who may be looking at the issue as a purely scientific endeavour may provide a much different take.

But, you know this already, and will inevitably claim that government monies are pure - and everything else is tainted by the evil petro-empire.

That being said, I think I am done here.

Thank you for your climate change hoax theory.
The Arctic is melting and it does not give a eff what you think.
It does not care if you have money or not.
It does not care if you are Left or Right in your politics.
It does not care if you are religious or not.
It does not care if you went to school or not it's melting because the planet is warming and CO2 is the reason.

Glad you are done and I wish OBD would do the same thing.
 
Because once again you are wrong.
The albedo of Earth

by Judith Curry

An important new paper finds that the albedo of Earth is highly regulated, mostly by clouds, with some surprising consequences.


The albedo of Earth

Graeme L. Stephens, Denis O’Brien, Peter J. Webster, Peter Pilewski, Seiji Kato, and Jui-lin Li

Abstract. The fraction of the incoming solar energy scattered by Earth back to space is referred to as the planetary albedo. This reflected energy is a fundamental component of the Earth’s energy balance, and the processes that govern its magnitude, distribution, and variability shape Earth’s climate and climate change. We review our understanding of Earth’s albedo as it has progressed to the current time and provide a global perspective of our understanding of the processes that define it. Joint analyses of surface solar flux data that are a complicated mix of measurements and model calculations with top-of-atmosphere (TOA) flux measurements from current orbiting satellites yield a number of surprising results including (i) the Northern and Southern Hemispheres (NH, SH) reflect the same amount of sunlight within ~ 0.2Wm2. This symmetry is achieved by increased reflection from SH clouds offsetting precisely the greater reflection from the NH land masses. (ii) The albedo of Earth appears to be highly buffered on hemispheric and global scales as highlighted by both the hemispheric symmetry and a remarkably small interannual variability of reflected solar flux (~0.2% of the annual mean flux). We show how clouds provide the necessary degrees of freedom to modulate the Earth’s albedo setting the hemispheric symmetry. We also show that current climate models lack this same degree of hemispheric symmetry and regulation by clouds. The relevance of this hemispheric symmetry to the heat transport across the equator is discussed.

Published in Reviews of Geophysics; [link] to full manuscript.

Excerpts from the Introduction:

There are many reasons why it is important to understand the variability of the Earth’s albedo and the factors that define it:

1. Simple energy balance models of the climate system are unstable to small changes in the amount of energy reflected to space. In these simple models with an albedo overly sensitive to surface temperature, relatively small changes in the absorbed solar energy can swing these models from a near ice-free Earth to a fully ice covered state.

2. It is also speculated that albedo changes potentially regulate the climate system. Lovelock’s Gaia hypothesis, exemplified in the study of “Daisyworld”, suggests that regulation of the system albedo by the adaptation of biota of differing albedos to climate change might in fact buffer the system from the instabilities inherent to earlier energy balance models.

3. The reflection of sunlight by clouds provides an important climate change feedback mechanism. Our inability to quantify these feedbacks with any certainty is recognized as one of the major obstacles in climate change predictions .

4. More locally, the Earths albedo appears to be resilient to other internal changes that might otherwise alter the system albedo. Perturbations to the albedo through effects of aerosol on clouds appears to be buffered by compensating processes that restrict local albedo changes to changing aerosol influences. The implications of these more local compensations to concepts proposed to mitigate climate change through geoengineering cloud albedo are thus profound.

5. Regulation of the Earth’s albedo is also central to other important climate feedbacks, including the snow/ice surface albedo feedback as well as cloud feedbacks.

6. It has also been conjectured that the characteristics of the total energy transport from low to high latitudes are insensitive to the structure and dynamics of the atmosphere-ocean system and are determined primarily by external controls such as the solar constant, the size of the Earth, the tilt of the Earth’s axis, and the hemispheric mean albedo.

We show, as in other studies, that the Northern and Southern Hemispheres (NH and SH) reflect the same amount of sunlight within 0.2Wm2. We show clearly how this is achieved as a consequence of reflection from increased amounts of SH clouds offsetting precisely the increased reflection from the larger NH land masses . The spectral distribution of this reflected energy exhibits clear differences between the hemispheres that reinforce our understanding of how the hemispheric symmetry is established.

The albedo appears to be highly constrained on the hemispheric and global scale and over interannual timescales. The hemispheric symmetry is an example of such a constraint, and the interannual variability of reflected energy is another example. The interannual variability is small, mostly regulated by the changes to clouds associated with the main modes of climate variability. Overall, these changes occur in a way that minimizes the global effects of clouds on the albedo, buffering the Earth system from large changes.

We also show that the ability of present-day models of climate in simulating the statistical properties of the energy reflected from Earth varies depending upon the metric used. Models produce a much more variable reflected sunlight than observed and fail to reproduce the same degree of hemispheric symmetry. Simple arguments suggest that a symmetric energy balance implies zero net cross equatorial transport of heat that is also a condition of a steady state. Although Earth is very near this symmetric state, it is out of energy balance, with less outgoing longwave radiative (OLR) emitted from the SH than the NH. This hemispheric asymmetry in OLR contributes to the approximate 0.6Wm2 imbalance observed and is associated with offsetting transports of heat from north to south in the atmosphere and from south to north in the oceans.

From the section Discussion:

Is the Hemispheric Symmetry Purely Coincidental? While Voigt et al. could not rule out the possibility of the observed hemispheric symmetry being merely accidental, their results suggest that mechanisms exist to minimize hemispheric differences in reflected shortwave irradiance and planetary albedo in some fundamental way. Voigt et al. searched for possible mechanisms in simple aqua-planet simulations using a general circulation model coupled to a slab ocean. The experiments were performed with the model initialized with an imposed hemispheric difference in clear-sky albedo. The results showed how the Intertropical Convergence Zone (ITCZ) adapted in such a way as to compensate for the imposed hemispheric asymmetries in clear-sky albedo. The compensation occurred as a shift of the ITCZ and tropical clouds into the darker hemisphere, suggesting that in these model simulations the climate system prefers hemispheric albedo asymmetries to be small and that cloudiness serves as a strong regulator of albedo. The main point of these studies is they show how adjustments of cloud patterns in one hemisphere can influence the properties of the other hemisphere, thus hinting at possible mechanisms that determine how a symmetric energy balance might be maintained.

From the Summary:

We also show, as others before, how the amount of solar energy reflected from each hemisphere is essentially identical. This symmetry appears in broadband data but not in spectral radiances, thus hinting at the importance of such spectral data as a diagnostic tool for studying Earth’s climate system. Again, the cloudiness of the planet is the principal regulatory agent that maintains this symmetry with the increased energy reflected from SH clouds precisely balancing the larger reflections from NH land masses. Simple arguments suggest that a symmetric energy balance implies zero cross equatorial transport of heat, which is a condition of a steady state. Although Earth is very near this symmetric state, it is currently out of energy balance with less OLR emitted from the SH than the NH giving rise to the approximate 0.6Wm2 global imbalance observed.

Climate models fail to reproduce the observed annual cycle in all components of the albedo with any realism, although they broadly capture the correct proportions of surface and atmospheric contributions to the TOA albedo. A high model bias of albedo has also persisted since the time of CMIP3,mostly during the boreal summer season. Perhaps more importantly, models fail to produce the same degree of interannual constraint on the albedo variability nor do they reproduce the same degree of hemispheric symmetry. The significance of these shortcomings is not yet fully known, but model studies of hypothetical slab-ocean worlds suggest that interhemispheric changes in albedo can grossly affect the climate states of those worlds, shifting the ITCZ and altering the amount of heat moved poleward.

JC reflections

The implications of this paper strike me as profound. Planetary albedo is a fundamental element of the Earth’s climate. This paper implies the presence of a stabilizing feedback between atmosphere/ocean circulations, clouds and radiation. Climate models do not capture this stabilizing feedback.

The results of this paper also have interesting implications for ice ages, whereby the forcing that is predominant in one hemisphere is felt in the other.

The failure of models to reproduce this hemisphere synchronicity raises interesting implications regarding the fidelity of climate model-derived sensitivity to CO2.

Moderation note: this is a technical thread, please keep your comments relevant.
 
The drawn-out Mann lawsuit: Science is not taking a stand for Michael Mann

Guest essay by John A.

It has been awhile since we’ve heard anything about the progress of the lawsuit, and so given the current toxic witchhunt against climate skeptics, perhaps it’s time to review again. I noticed a couple of posts on Mark Steyn’s blog regarding the suit brought against him by Michael Mann, WUWT’s favorite climate scientist, which I felt should be brought to a wider audience.

First off, no scientific organization has filed amici briefs supporting Mann’s suit against the National Inquirer, the CEI or Mark Steyn:

A few [months] ago, you’ll recall, the ACLU, The Washington Post, NBC News, The Los Angeles Times and various other notorious right-wing deniers all filed amici briefs opposed to Michael Mann and his assault on free speech. They did this not because they have any great love for me, but because their antipathy to wackjob foreign blowhards is outweighed by their appreciation of the First Amendment – and an understanding of the damage a Mann victory would inflict on it. After noting the upsurge of opposition to Mann, Reuters enquired of Catherine Reilly (one of his vast legal team) whether there would be any amici filing pro-Mann briefs:

I asked Reilly if the professor would have any supporting briefs next month when he responds to the defendants in the D.C. appeals court.

“At this point, we don’t know,” she said.

Ms Reilly was a pleasant sort when I met her in court over a year ago, but she struck me as a formidable opponent. So I naturally assumed that the above was what what the political types call “lowering expectations”. As I wrote:

“I would be surprised if Mann didn’t have any supporting briefs. I was in court when Ms Reilly’s genial co-counsel made his argument for Mann, which was a straightforward appeal to authority: Why, all these eminent acronymic bodies, from the EPA and NSF and NOAA even unto HMG in London, have proved that all criticisms of Mann are false and without merit. So I would certainly expect them to file briefs – and, given that Mann sees this as part of a broader “war on science” by well-funded “deniers”, I would also expect briefs from the various professional bodies: the National Academy of Sciences, the American Physical Society, etc. As pleasant as it is to find my side of the court suddenly so crowded, I’m confident Mann will be able to even up the numbers.”

Well, yesterday was the deadline, and not a single amicus brief was filed on behalf of Mann. Not one. So Michael Mann is taking a stand for science. But evidently science is disinclined to take a stand for Michael Mann.

Now that IS surprising, because I would have thought that someone, some interested organization would be supporting Mann. I could think of the IPCC or Al Gore or Penn State University or the University of Virginia or the University of East Anglia’s Climate Science Unit or the AAAS or the WMO or some body or other.

The self-appointed captain of the hockey team is playing solo. As Judith Curry wrote last month:

“The link between ‘defending Michael Mann is defending climate science’ seems to have been broken.”

As yesterday’s deafening silence confirms. If you’re defending Michael Mann, you’re not defending science, or defending climate science, or theories on global warming or anything else. Defending Michael Mann means defending Michael Mann – and it turns out not many people are willing to go there.

Truly the silence is deafening. It’s not a good sign that no organization associated with the research into the perils for future global warming felt any need to support Mann in his Valiant Defense of Science by filing a brief.

Oh brother climate scientists, where art thou?

The second update I noticed was Mann’s repudiation of his own smoothed (and artfully pruned) hockey stick.

Here’s the graphic:


And here’s what Mann has told the court (with emphasis by Steyn):

In their brief, the CEI Defendants suggest that the University of East Anglia’s investigation actually found that the hockey stick graph was “misleading” because it did not identify that certain data was “truncated” and that other proxy and instrumental temperature data had been spliced together… This allegation is yet another example of Defendants’ attempts to obfuscate the evidence in this case. The “misleading” comment made in this report had absolutely nothing to do with Dr. Mann, or with any graph prepared by him. Rather, the report’s comment was directed at an overly simplified and artistic depiction of the hockey stick that was reproduced on the frontispiece of the World Meteorological Organization’s Statement on the Status of the Global Climate in 1999.41 Dr. Mann did not create this depiction, and the attempt to suggest that this report suggested an effort by Dr. Mann to mislead is disingenuous.

Disingenuous: adjective “not candid or sincere, typically by pretending that one knows less about something than one really does.”

Except as Steyn points out, that particular depiction was claimed to have been created by Mann and other Hockey Team members because Mann claimed that he did on his online resume:


So who or what to believe? Mann’s own resume or Mann’s deposition to the Court?

It’s a brain-buster for sure.

I’m sure that Mann will be projecting himself to be a lone scientific David bravely fighting the evil Denialist Fossil-Fuel funded Goliath. But unless Mann is seriously packing heat in his slingshot, it looks to me somewhat dicey from this vantage point.

Someone is going to lose heavily in this Climate Loserweight Title Fight. I can’t see it going the distance.
 

Attachments

  • image.jpg
    image.jpg
    31.8 KB · Views: 19
  • image.jpg
    image.jpg
    107.6 KB · Views: 19
  • image.jpg
    image.jpg
    27.2 KB · Views: 20
"97% of climate scientists have concluded that human-caused climate change is happening.
And here is the proof http://iopscience.iop.org/1748-9326/8/2/024024/

What do you want for your children?"

A Wikipedia entry pushing a cooked consensus, followed by a, "Think of the Children!"?

If an argument from authority was what I was looking for I'd join the Catholic Church.

I hear 97% of priests believe in God.

I assume you'd take the same approach when it comes to managing your health, correct? E.g. if by some unfortunate luck, you are diagnosed with say cancer - rather than seeking the consensus advice of those who are the best educated in the the field, you'll just go with your own ideas of what would be the best treatment - correct?

And yes, this is a valid analogy since I'm 100% confident that regardless of what diagnosis and what medical advice you receive, I'm 100% confident I can find a handful of people on the internet who will tell you to do something other than the consensus medical opinion. I can probably find some who will claim that research based consensus opinion is part of some vast conspiracy created by government funded researchers who are in some way "less pure" than those who provide alternate advice.
 
Be scared, be very scared.

Climate change cause mummies to turn to 'black ooze'

The world's oldest mummies are at risk of disappearing because of man-made climate change, according to a group of Harvard University scientists.

Bodies mummified about 7,000 years ago in Chile are starting to degrade rapidly, the Harvard School of Engineering and Applied Sciences said Monday in an e-mailed statement. Tests by Harvard's Alice DeAraujo and Ralph Mitchell show that microbes that flourish in an increasingly humid climate are turning the preserved remains of Chinchorro hunter-gatherers into "black ooze."

"Is there a scientific answer to protect these important historic objects from the devastating effects of climate change?" said Mitchell. "It's almost a forensic problem."

Mitchell, who has pinpointed the causes of decay in everything from the walls of King Tutankhamun's tomb to Apollo space suits, worked with DeAraujo on mummies supplied by Marcela Sepulveda, professor of archaeology at the University of Tarapaca in Chile. While museums can control their environments to preserve artefacts, many Chinchorro mummies are buried just beneath the surface in valleys that are experiencing higher humidity levels due to climate change, Sepulveda said.

"In the last 10 years, the process has accelerated," said Sepulveda, commenting on the decay suffered by the 120 mummies in Tarapaca's archaeological museum.

Bloomberg News

Copyright © 2015, Chicago Tribune
 

Attachments

  • image.jpg
    image.jpg
    30.3 KB · Views: 12
Forecasting global climate change: A scientific approach
Kesten C. Green
University of South Australia and Ehrenberg-Bass Institute, Australia
J. Scott Armstrong
University of Pennsylvania, U.S.A, and Ehrenberg-Bass Institute, Australia
Working Paper – June 2014
Subsequently published as “Forecasting Global Climate Change” in Climate Change: The Facts 2014. Alan Moran (Editor). Published by the Institute of Public Affairs, Melbourne, Victoria 3000, Australia
Abstract
The Golden Rule of Forecasting requires that forecasters be conservative by making proper use of cumulative knowledge and by not going beyond that knowledge. The procedures that have been used to forecast dangerous manmade global warming violate the Golden Rule. Following the scientific method, we investigated competing hypotheses on climate change in an objective way. To do this, we tested the predictive validity of the global warming hypothesis (+0.03°C per year with increasing CO2) against a relatively conservative global cooling hypothesis of -0.01°C per year, and against the even more conservative simple no-change or persistence hypothesis (0.0°C per year). The errors of forecasts from the global warming hypothesis for horizons 11 to 100 years ahead over the period 1851 to 1975 were nearly four times larger than those from the global cooling hypothesis and about eight times larger than those from the persistence hypothesis. Findings from our tests using the latest data and other data covering a period of nearly 2,000 years support the predictive validity of the persistence hypothesis for horizons from one year to centuries ahead. To investigate whether the current alarm over global temperatures is exceptional, we employed the method of structured analogies. Our search for analogies found that environmental alarms are a common social phenomenon, with 26 similar situations over a period of two hundred years. None were the product of scientific forecasting procedures, and in all cases the alarming forecasts were wrong. Twenty-three of the alarms led to government actions. The government actions were harmful in 20 cases, and of no benefit in any.


I assume you'd take the same approach when it comes to managing your health, correct? E.g. if by some unfortunate luck, you are diagnosed with say cancer - rather than seeking the consensus advice of those who are the best educated in the the field, you'll just go with your own ideas of what would be the best treatment - correct?

And yes, this is a valid analogy since I'm 100% confident that regardless of what diagnosis and what medical advice you receive, I'm 100% confident I can find a handful of people on the internet who will tell you to do something other than the consensus medical opinion. I can probably find some who will claim that research based consensus opinion is part of some vast conspiracy created by government funded researchers who are in some way "less pure" than those who provide alternate advice.
 
Status
Not open for further replies.
Back
Top