Seagirt
Active Member
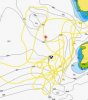
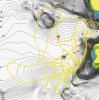
Has anyone made use of the Navionics App's new function, SonarChartsLive, to add higher resolution bathymetry to their charts at the moment they are collecting the data? Navionics has been incorporating user data into their charts with a turn around time of (they say) a week but having it instantly with SonarChartsLive is much more appealing.
A wifi connection with your sounder is required, and some sounders have this built in. An alternative, if your fishfinder outputs depth data as NMEA, is sonarserver. Sonarserver outputs your depth data as a wifi signal that your phone or tablet connects to. The phone stores these newly created maps for later use. The more coverage you get of an area the more detail it adds to your charts, and it does so instantly.
Anyone used the Sonarlive yet?
See Navionics Sonarchartlive http://www.navionics.com/en/sonarchart-live
and www.sonarserver.com