Climate: LNG in B.C. vs Alberta tarsands

Status
Not open for further replies.
US Govt Scientists Confirm: Natural Climate Change of Past Produced Warmer Temps Than Modern Era


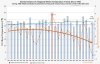
First, the DOE scientists who produced this chart attached instrument thermometer readings to reconstructed proxy estimates. This is truly an apple-to-orange comparison without any scientific validity. It's a science 'no-no' in lay terms. In addition, modern era proxy reconstructions reveal a temperature decline since 1960 that these DOE scientists conveniently fail to mention identify.
attachment.php


Alas, in the scheme of actual climate empirical evidence, modern warming is not so much as it turns out. It's those stubborn facts, again.

Say what??? where is your source for this chart? Oh there it is on the chart.... um does that look like photoshop?
Look at the word Thermometer on the right... doesn't look right does it?
Here is the history of this new nonsense from OBD and his team of coming up short.
http://www.realclearenergy.org/char...ng_going_back_to_the_cambrian_era_108320.html
285840_5_.jpg


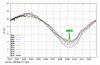
Now if we take one more step back we find this.....

http://www.forbes.com/sites/jamesco...-directly-linked-to-global-warming/?ss=energy

Paleotemperatures.jpg

Source: Judith Parrish and Gerilyn Soreghan, http://en.wikipedia.org/wiki/File:All_palaeotemps.png; Berger and Loutre, 2002; Berner 2006; Royer et al. 2004, and others.

Yup the same graph from forbes but this time they tell us the source

And now we can see the source of the graph is from wikipedia and someones attempt to put a perspective on things.
http://en.wikipedia.org/wiki/File:All_palaeotemps.png#filehistory

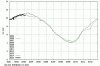
Here is the current version of the graph

All_palaeotemps.png


OBD see those to red dots on the right had side?
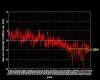
Do you not find that troubling that we are on track for that if we don't listen to what 97% of the climate scientist are telling us? Are you willing to gamble that you are right and the rest of the world is wrong? What's your backup plan if it turns out that you are wrong?
 
A “climate connection” isn’t the same thing as a “manmade global warming connection,” and “climate model results” aren’t exactly convincing support for anything.

Do tell us what this "climate connection" is then and what mechanism is behind it.
Perhaps you are onto something profound.....
 
Why is the Arctic so important? What's happening up there? Here we have an article from what economist read not some magazine that is known for it's liberal views. When you see that you know things are changing.

<hgroup class="typog-content-header main-content-header" style="margin-bottom: 5px; color: rgb(74, 74, 74); font-family: Arial, sans-serif; font-size: 14px; line-height: 22px;">[h=2]The Arctic Ocean[/h][h=3]Awakening[/h]http://www.economist.com/news/scien...t-sea-stirring-consequences-are-both-good-and
[h=1]Earth’s northernmost sea is stirring. The consequences are both good and bad[/h]</hgroup><aside class="floatleft light-grey" style="float: left; color: rgb(123, 123, 115); font-family: Arial, sans-serif; font-size: 14px; line-height: 22px; margin: 0px 15px 10px 0px !important;"><time class="date-created" itemprop="dateCreated" datetime="2015-02-14T00:00:00+0000" style="font-size: 1.2rem; line-height: 1.6rem;">Feb 14th 2015 </time>| TROMSO, NORWAY | From the print edition

20150214_STP001_0.jpg


IN NOVEMBER 2011 an American icebreaker, USCGC Healy, set off from Seward, Alaska, to sail north through the Arctic Circle into the Chukchi Sea. It was the beginning of the winter-long polar night. Sea ice was forming. The sun did not appear in the northern Chukchi for weeks. Those on board expected creatures to be sparse in number and entering hibernation. Instead, they found a ferment of activity.
Robert Campbell of the University of Rhode Island, one of Healey’s supercargo of scientists, outlined the details at Arctic Frontiers, a scientific conference held in Tromso, Norway, last month. His research, and that of his colleagues, showed that planktonic animals such as copepods (pictured above) and krill were abundant, active and grazing on the still smaller algae of the phytoplankton, themselves adapted to manage with the tiniest sliver of winter light. Instead of hibernating, they were developing. Larvae were turning into adults and a few species were even reproducing. This revelation of life in the middle of the polar night is one of many surprises of recent Arctic science. And that knowledge is changing people’s understanding of the world’s northernmost habitat.

The Arctic, sparsely populated and rarely visited by outsiders, is easily forgotten by those at lower latitudes. But it is where the impact of a warming climate is most vividly seen. A 1°C rise in temperatures at the equator—from, say, 25°C to 26°C—will have effects, but does not change much. A rise from 0°C to 1°C melts the ice. That changes everything, from local biology to global meteorology.
And the Arctic is melting fast. Julienne Stroeve, of the National Snow and Ice Data Centre in Boulder, Colorado, calculates that between 1953 and 2014 the average area of the Arctic sea ice shrank by 48,000km[SUP]2[/SUP] a year (a three-hundredth of its winter extent). Between 1979 and 2014 it shrank by 87,000km[SUP]2[/SUP] a year. Between 1996 and 2014, the rate rose to 148,000km[SUP]2[/SUP], even though the past two seasons have seen an increase in summer ice compared with the low point in 2012.
20150214_stm002.png


This accelerating rate involves two feedback loops—one well-known, the other less so. The well-known one is that ice reflects sunlight but water, which is darker, absorbs it. So as water replaces ice, more heat is retained. In 1980 the Arctic Ocean absorbed 38% of incoming solar energy. By 2010 it absorbed 63%. This warms the water, melting more ice from beneath.
That phenomenon triggers the second feedback loop. In the 1980s Arctic sea ice was about 3 metres thick. Some would melt in summer and freeze again in winter, but most would remain throughout the year. This is multi-year ice. Now, millions of square kilometres melt away in summer and refreeze in winter. This is first-year ice. The two have different properties. Multi-year ice is eroded by the wind and pounded from below by ocean currents, so its surface is pitted and ridged. First-year ice, in contrast, is unscarred by time.
When multi-year ice thaws, the meltwater gathers on its surface, forming ponds between the ridges. That means a fair amount of ice remains uncovered, and continues to reflect sunlight. Meltwater from first-year ice, though, spreads right across the smooth surface, reducing reflectivity far more. In 1985, 70% of Arctic ice was multi-year and 30% first-year. By 2012, those proportions were reversed. And the biggest loss is of ice five years old or more. This sort is the crinkliest, and reflects most light of all. It has shrunk from 30% of the total in 1980 to 5% now.

Let the sun shine in
For living things, this should be excellent news. More open water means more light, which means more photosynthesis. Primary production, as carbon compounds produced by this photosynthesis are known, is rising. Antje Boetius of Bremen University says the seabed at the North Pole is now green—or would be if you could see it—because so much photosynthesis has taken place at the surface and the algae have died and sunk to the bottom. According to Mar Fernández-Méndez of the Alfred Wegener Institute in Bremerhaven, in the summer of 1982 a column of Arctic seawater with a cross-sectional area of a square metre fixed 26 milligrams of carbon a day. By 2012 that figure had risen to 34-53mg.
With rising primary production, and thus more food available, you might expect the rest of the ecosystem to be flourishing, too. And some of it is. There has, for example, been a substantial increase in the number of cod—especially of sexually active cod, more than seven years old. These fish are also now found much closer to the pole than they used to be, at 79° or 80° north. Harbour seals are doing well, too. A colony on Svalbard is the species’s northernmost outpost. Unlike some other seals, harbour seals do not depend on ice to give birth or to moult, so the ice’s retreat is less bothersome to them. And as a predominantly temperate species, they benefit when waters warm up.

Other species, though, are being squeezed by competition from these newcomers and by changing conditions in general. In the waters where cod thrive, minke whales and harp seals are struggling, at least to judge by the condition of their blubber. A study by Bjarte Bogstad of Norway’s Institute of Marine Research found that the blubber of both species had declined from being more than 40mm thick in the early 1990s to less than 35mm now.
The whales may be suffering because the Arctic zooplankton on which they feed are being replaced by more temperate species that are harder to catch or less nutritious. Harp seals suffer directly because they depend on ice (they give birth on it, moult on it and use it for rest while hunting). If the ice is too thin, their pups fall into the water and drown. They also suffer indirectly, through the loss of their main prey, a fish called the capelin, which has begun to swim northward in search of cooler waters. Garry Stenson of Fisheries and Oceans Canada, a government agency, reckons that the number of harp-seal miscarriages has risen greatly in response.

Harp seals exemplify the difficulty of adapting to changing conditions. The obvious response for an ice-dependent animal such as a harp seal would be to follow the retreating ice—in its case, northward from its breeding grounds near Newfoundland. But that would bring the seals closer to their main predator, the polar bear (which eats seal pups). Dr Stenson says harp seals will swim north, but only if there is no ice in March, as happened in 2010. In 2011 there was a little March ice and they stayed put—only to be almost wiped out when the ice melted later in the summer.
This sort of thing, of course, is all part of the cut and thrust of ecology. More worrying to those who study the Arctic’s biological awakening is that the rise in primary production which sustains it might suddenly be capped.
Light is not the only requirement for life. The phytoplankton that sit at the bottom of the food chain need nutrients such as nitrates (to make proteins) and silicates (to make protective shells). Dr Fernández-Méndez thinks a shortage of these may limit the Arctic Ocean’s productivity even if most of the ice melts and exposes the water beneath to light.
Jon Lawrence of Britain’s National Oceanography Centre has looked at what might happen to nutrient availability and productivity in an ice-free Arctic. He concluded that, as the ice melted, primary production would rise by only 11%, not 300%, as a linear extrapolation would suggest.
20150214_stc127.png


</aside>
 
Cont.....

The reason is the green seabed. The dead algae have taken the nitrate with them. Something similar happens in other oceans, of course, but in the Arctic the lost surface nitrates do not seem to be being replenished—perhaps because of a lack of the upwelling currents found elsewhere. Mr Lawrence calculates that almost all the extra productivity the Arctic is likely to see will thus take place at least 20 metres below the surface, where it is pretty dark regardless of ice. Productivity at the surface itself, by contrast, is flat.
Another reason the Arctic’s creatures may not flourish in the extra sunlight is that they have evolved to take advantage of a short summer. This season is so compressed that the timing of plant growth, animal births and feeding cycles has to be closely synchronised. A few days makes a difference. Copepods, for example, emerge just before the peak bloom of algae. If the ice melts early, the algae will bloom early too and then die. The newly emerging copepods will thus not have enough to eat. And since copepods are food for predators, the ecosystem as a whole will suffer.
To capture the impact of changing environmental conditions on food webs as a whole (rather than on individual species), two recent studies built computer models to describe them. These looked at how many species are in a web, how many links there are between these species (ie, who eats whom), where the species live, and whether that is changing. Both models suggested that the condition of some Arctic food webs is coming under strain.
Building ecological models is, however, a tricky business. Even in well-studied habitats all the variables are rarely understood. And evolution can happen quickly if the pressure is great enough. For example, copepods whose internal clocks better matched changed conditions would spread rapidly.
Winds of change
All of which is fascinating. From the human, rather than the copepod point of view, though, the biggest question about the Arctic is this: is it affecting other parts of the Earth’s climate—those regions where people live? Jennifer Francis of Rutgers University argues that it is.
Because the poles are cold, warm air flows from the equator north and south in order to equalise temperatures. The Earth’s rotation disturbs these air currents, creating (in the northern hemisphere) the jet stream, which flows around the planet in a wavy pattern, bringing up warm air and making north-west Europe hotter than other places at the same latitude.
If the temperature gap between the north pole and the equator narrows (because the Arctic is warming faster), then the poleward flow of air might falter. And wind speeds have indeed been dropping. That could have two consequences. One is that it may increase the so-called “Siberian High”, a huge build-up of dry, freezing air that is known to affect much of the northern hemisphere’s weather—for there seems to be a link between the loss of sea ice in parts of the Arctic and lower temperatures in Siberia. The other is that, as the jet stream weakens, its waves become exaggerated, creating pockets of air connected with extreme weather events, such as the exceptional cold that hit the American Midwest in January 2014.
20150214_stc131.png


Both ideas are controversial. The links between these weather patterns and the warmer Arctic are unproven. Some climate scientists dismiss them as statistically irrelevant. Variation is so great, they argue, that if there is some sort of signal from the melting Arctic, it is being lost in the noise. For the same reason, however, it is too early to write off the signal altogether. Only time will allow it, if it exists, to be separated from the noise.
One thing does seem certain, though. Whether the Arctic Ocean’s awakening is for good, or ill, or both, it is unstoppable. That makes understanding it, and anticipating its effects, essential.
 
NASA Expert's Over-The-Top Global Warming Hysteria? 'Uh....It's Dead, Jim'

Winter can be sooo cruel...especially for scientists who have long immersed themselves in the pile of manure that CO2 CAGW hysteria represents...good news, though!...NASA and James Hansen have a fallback position...namely, the previous climate hysteria predictions they and the press were pushing on Congress and the public.....

NASA james hansen co2 global warming US winter 2015 030215
(click on chart to enlarge)
This updated NOAA U.S. temperature map is a stark reminder of the incredibly cold climate that northern and eastern areas of the US have recently experienced. The bitter cold, in particular, impacted those regions east of the Mississippi River, with states butting up against Canada taking the brunt.

It's also a reminder of those predictions by NASA experts and computer models, as promulgated during 1988 congressional testimony, that accelerated global warming would significantly impact the U.S., with many "experts" then claiming our future was one of warmer winters and no snow.

More to that point is the adjacent chart of US Nov/Dec/Jan temperatures (28 years) and trends since that 1988 testimony. It represents the following 8 states: Wisconsin, Michigan, Ohio, Pennsylvania, New York, Vermont, New Hampshire and Maine (all these states are east of the Mississippi and share a border with Canada).

To summarize the chart essentials:

1. Winter temperatures (Nov/Dec/Jan) exhibit a strong variability (the blue columns). Clearly, increasing atmospheric CO2 levels during this period has not caused ever-warmer winters.

2. Many of the winters are below the 1988 average of 27.58°F, including the winters of 2014 and 2015. (see blue dashed line)

3. Despite the very warm winter of 2002, the overall warming trend (orange curves) of winter temperatures has collapsed to a cooling trend of -5.7°F. There is no escaping the obvious NOAA empirical evidence that greenhouse gases are not producing the predicted accelerated warming.

4. The 10-year average winter temperature (the green curve) peaked in 2007 from a low experienced in 1989. Without any doubt, those few very exceptional warm winters (5 of the 28 winter datapoints) have definitely moved the average up. With that said, since 2007 it has declined slightly.

Is the U.S. just a rare anomaly where a cooling winter trend, not warming, is happening? Unfortunately, for the public and CAGW-scientists, regions with cooling trends are becoming more common.

Additional current empirical evidence that CO2 does not cause dangerous "warming" winters:

February 2015 – Toronto’s coldest month ever
Record low temperature in Cuba
Detroit – Coldest February in 140 years
Record snowfall paralyzes Istanbul
And now, snow in all 50 states
More than 1,900 cold records broken in one week – NOAA
More record lows across southern Ontario
Spain – The snow has no end
Denver breaks 103-year-old snowfall record
Record snowfall in Louisiana
Heavy snowfall paralyses life in Azerbaijan
Washington D.C. breaks 120-year cold record
Record snowfall in Tibet
Great Lakes “likely to have the most ice since records began,” says meteorologist
Coldest temps since 1800s in Eastern Half of U.S.
Heavy snowfall causes road closures in Mexico
Egypt – Snow coats the streets of Alexandria
Breaking snow records in Sweden
Heavy Snow Blankets Jerusalem
French ski resorts closed – Too much snow
Southern Norway “drowning in snow”
Bangladesh – Hospitals packed with patients suffering cold-related diseases
Fears for Siberia’s wildlife as heavy snowfall reaches depths of one meter
Heavy snowfall in Saudi Arabia
Record-shattering snowfall disrupts global warming forum in Boston
1,700 Private Jets Fly to Davos, Switzerland to Discuss Global Warming
Another ‘Little Ice Age’ is on the way, says space scientist
Additional regional and global temperature charts.

Note: Source of dataset for 8-state winter temperature chart produced by Excel. Using Excel calculated the 8-state winter months average; the 10-year trends and averages that begin with year 1988 on the chart used U.S. winter (Nov/Jan/Dec) temperature data starting with November 1979. The 1988 blue-diamond column on chart represents year of James Hansen global warming testimony.
 

Attachments

  • image.jpg
    image.jpg
    40 KB · Views: 24
NASA Expert's Over-The-Top Global Warming Hysteria? 'Uh....I'm brain Dead, Jim'

Winter can be sooo cruel...especially for scientists who have long immersed themselves in the pile of manure that CO2 CAGW hysteria represents...good news, though!...NASA and James Hansen have a fallback position...namely, the previous climate hysteria predictions they and the press were pushing on Congress and the public.....
Where did you get this nonsense, from Grade3Headlines.con?
Congratulation your team of coming up short has just proved it's winter.
Are you predicting a new ice age again?
If not, do you think 2015 will be the new hottest year on record?
You do realize that 97% of the climate scientist have confirmed that man-made climate change is real and it's a serious problem don't you.

Think this is going to turn out well....
Remember what happened in 2012?
If not, it was the lowest Arctic sea ice extent in recorded history.
N_stddev_timeseries.png
 
Last edited by a moderator:
Now I know why team coming up short made the cold winter play.
It was because of this news coming out of Russia (far bigger land mass then OBD's day dream team reported)

Outgoing winter proves warmest in Russia in history of weather monitoring

MOSCOW, March 2. /TASS/. The outgoing winter, which ended a couple of days ago according to the calendar, has proved the warmest in the history of weather monitoring in Russia conducted since 1891, the Federal Service for Hydrometeorology and Environmental Monitoring said on Monday.
Over the past winter the average air temperatures in almost all Russian regions were two degrees above the norm as a minimum; on some territories it was even warmer. The past winter proved particularly mild in the Central, Northwest, Siberian and the Far Eastern Federal Districts, where seasonal air temperatures were 4-7 degrees above the norm.
http://tass.ru/en/non-political/780560

0115tempsglobal.jpg


The causes of big climate
Mar 9, 2015
Climate: IPCC
Judith Curry points us to the draft of a paper soon to be published in the Independent Review, the journal of the Independent Institute. Written by two economists, it takes the idea of the big player - a well-established concept among economic thinkers - and uses it to try to explain the groupthink that plagues the climate debate. As the authors explain:

In markets, prototypical Big Players are central banks and government agencies empowered with discretionary policymaking... [M]arkets dominated by Big Players are prone to herding, where market participants, with little reliable information as to the Big Player’s next move, look to what others are thinking and doing.

As far as scientific endeavour goes, the authors suggest that big players can prevent the feedback mechanisms that provide a wide variety of information to "market" participants. And when it comes to the IPCC the situation is even worse:

Professional success in climate science has become more tied to the acceptance of the IPCC’s pronouncements than with the exploration of contrary possibilities; in fact, scientists who profess competing hypotheses are routinely castigated as “deniers” and some have reported unusual difficulties in negotiating the publishing process.

While a large majority of climate scientists are reported as being in general agreement with the AGW hypothesis and with the IPCC’s pronouncements, the accuracy and extent of this consensus has been questioned. The oft-quoted 97% number may be unrealistic and unsupportable, but the general acceptance by the majority of scientists having any connection to climate science seems real enough. This herding is a predictable result of the IPCC’s Big Player presence.

This all seems spot on to me.
 
A Return To 2006 Arctic Ice Conditions

The summer of 2006 had the highest minimum Arctic sea ice extent of the last decade.

ScreenHunter_7810 Mar. 09 06.50

Over the last two years, Arctic sea ice has closely tracked 2006.

ScreenHunter_7808 Mar. 09 06.45

This is due to the large increase in old/thick ice which has occurred since 2011. Older ice is much harder to melt in the summer, so there is less fluctuation between winter and summer.

MYI2011-2014

The sea ice area anomaly graph has flatlined over the past 10 years.

ScreenHunter_7811 Mar. 09 07.03

iphone.anomaly.arctic.png (512×412)

Arctic sea ice is recovering, because the winds which had been pushing the old/thick ice out of the Arctic Basin are not as strong as they were during the previous 15 years.
 

Attachments

  • image.jpg
    image.jpg
    95.3 KB · Views: 19
  • image.jpg
    image.jpg
    84.1 KB · Views: 19
  • image.jpg
    image.jpg
    89.8 KB · Views: 19
11034901_955138027864802_7932549844990542164_n.jpg
 
A Return To 2006 Arctic Ice Conditions

Well there you go, ScreenHunter_7808 and his wild butt guess is based on what, a green line?
OBD are you just the assistant, to the assistant Merchant of Doubt ?.... 3 rings down the ladder into a black hole of reason.


RBRWuG0320_Global_T_anomaly_1880_2014_from_20_century.png
 
Last edited by a moderator:
GREEN FIASCO: 92% OF SWISS VOTERS REJECT CARBON TAX IN REFERENDUM

Swiss voters Sunday overwhelmingly rejected an initiative that would have scrapped the Alpine country’s value-added-tax system and replaced it with a carbon tax, a move that would have made gasoline, heating oil and other forms of power more expensive for consumers.


Roughly 92% of voters opposed the initiative, known as “Energy Rather than VAT,” while 8% supported the measure, according to preliminary results from 13 of the country’s 26 cantons.

The initiative would have encouraged Swiss households to use renewable energy sources, including solar and wind, which would have been exempt from taxes. The initiative, which was introduced by the Green Liberal Party of Switzerland, was designed to help lower carbon emissions and reduce global warming.

The Swiss cabinet had recommended voters reject the proposal because it would likely have caused a falloff in revenue for the federal government. The current VAT tax, which ranges from 2.5% to 8%, generated income of 22.6 billion Swiss francs ($22.92 billion) for the federal government in 2013, according to government data.

The initiative was backed by the Green Liberal Party of Switzerland and supported by the Green Party of Switzerland, the World Wildlife Fund and Greenpeace Switzerland.

Full story
 
GREEN FIASCO: 92% OF SWISS VOTERS REJECT CARBON TAX IN REFERENDUM

I see your team put on their thinking caps with with that headline LOL... coming up short again I see.

So they want to keep the vat and not trade it for carbon tax.... interesting.
Another thing that is interesting is they are the first in the world to comit to Paris 2015.
Reduce CO2 by 50% by 2030. Well done Switzerland.....

http://www4.unfccc.int/submissions/indc/Submission Pages/submissions.aspx

here is the PDF with the details...
http://www4.unfccc.int/submissions/...15 02 27_INDC Contribution of Switzerland.pdf


2015Toon10.png
 
Last edited by a moderator:
Tick Tock OBD your time is running out

[j8ii9zGFDtc]https://www.youtube.com/watch?v=j8ii9zGFDtc
 
Climate Change Predictions Incorrect

obama greatest threat"But the debate is settled. Climate change is a fact," said President Barack Obama in his 2014 State of the Union address. Saying the debate is settled is nonsense, but the president is right about climate change. GlobalChange.gov gives the definition of climate change: "Changes in average weather conditions that persist over multiple decades or longer. Climate change encompasses both increases and decreases in temperature, as well as shifts in precipitation, changing risk of certain types of severe weather events, and changes to other features of the climate system." That definition covers all weather phenomena throughout all 4.54 billion years of Earth's existence.

You say, "Williams, that's not what the warmers are talking about. It's the high CO2 levels caused by mankind's industrial activities that are causing the climate change!" There's a problem with that reasoning. Today CO2 concentrations worldwide average about 380 parts per million. This level of CO2 concentration is trivial compared with the concentrations during earlier geologic periods. For example, 460 million years ago, during the Ordovician Period, CO2 concentrations were 4,400 ppm, and temperatures then were about the same as they are today. With such high levels of CO2, at least according to the warmers, the Earth should have been boiling.

Then there are warmer predictions. In the wake of Hurricane Katrina, warmers, such as the Union of Concerned Scientists, made all manner of doomsday predictions about global warming and the increased frequency of hurricanes. According to the Committee for a Constructive Tomorrow, "no Category 3-5 hurricane has struck the United States for a record nine years, and Earth's temperature has not budged for 18 years."

Climate change predictions have been wrong for decades. Let's look at some. At the first Earth Day celebration, in 1969, environmentalist Nigel Calder warned, "The threat of a new ice age must now stand alongside nuclear war as a likely source of wholesale death and misery for mankind." C.C. Wallen of the World Meteorological Organization said, "The cooling since 1940 has been large enough and consistent enough that it will not soon be reversed." In 1968, Professor Paul Ehrlich predicted that there would be a major food shortage in the U.S. and that "in the 1970s and 1980s hundreds of millions of people (would) starve to death." Ehrlich forecasted that 65 million Americans would die of starvation between 1980 and 1989 and that by 1999, the U.S. population would have declined to 22.6 million. Ehrlich's predictions about England were gloomier. He said, "If I were a gambler, I would take even money that England will not exist in the year 2000."

In 1970, Harvard University biologist George Wald predicted, "Civilization will end within 15 or 30 years unless immediate action is taken against problems facing mankind." Sen. Gaylord Nelson, in Look magazine in April 1970, said that by 1995, "somewhere between 75 and 85 percent of all the species of living animals (would) be extinct."

Climate change propaganda is simply a ruse for a socialist agenda. Consider the statements of some environmentalist leaders. Christiana Figueres, the U.N.'s chief climate change official, said that her unelected bureaucrats are undertaking "probably the most difficult task" they have ever given themselves, "which is to intentionally transform the (global) economic development model." In 2010, German economist and Intergovernmental Panel on Climate Change official Ottmar Edenhofer said, "One must say clearly that we redistribute de facto the world's wealth by climate policy." The article in which that interview appeared summarized Edenhofer's views this way: "Climate policy has almost nothing to do anymore with environmental protection. ... The next world climate summit in Cancun is actually an economy summit during which the distribution of the world's resources will be negotiated."

The most disgusting aspect of the climate change debate is the statements by many that it's settled science. There is nothing more anti-scientific than the idea that any science is settled. Very often we find that the half-life of many scientific ideas is about 50 years. For academics to not criticize their colleagues and politicians for suggesting that scientific ideas are not subject to challenge is the height of academic dishonesty.

Walter E. Williams is a professor of economics at George Mason University.

Source
 
Climate change propaganda is simply a ruse for a socialist agenda.
Walter E. Williams is a professor of economics at George Mason University.

Source

Ah yes the old it's a socialist plot to control the world under one government by the UN. The giant hoax theory that only people in deep denial can see while the rest of us are somehow not able to comprehend what is truly going on....

Seek help OBD you are off the edge of reality....
Nature could not give a eff what you think or post she will do what takes to get into balance.

N_stddev_timeseries.png


26_ERB_Stefan_Rahmstorf.jpg
 
Last edited by a moderator:
Chilling Climate Change at New York Times

Yes, climate really does change, running hot and cold with mainstream media news cycles. Just one week after the New York Times showcased a Feb. 21 hatchet piece on Dr. Willie Soon, a man-made climate alarm doubter at the Harvard-Smithsonian Center for Astrophysics “who claims that variations in the sun’s energy can largely explain recent global warming”, its front page Feb. 27 piece was far more chilling.

Headlined “28 Days on Ice” and illustrated with dramatic ice and snow scenes, the later feature indicates that Dr. Soon along with other skeptical scientists may have very good reasons to doubt that any crisis exists after all. As the subtitle states, “From the Hudson to La Guardia Airport, this February may be New York’s coldest since 1934, the National Weather Service Says.”

Before I go any further with this, let me be very clear that neither I nor anyone I know doubts that climate changes. This has been going on throughout our planet’s history — beginning long before the Industrial Revolution introduced smokestacks and SUVs.

Let’s also recognize a big difference between local and ever-changing short-term weather events and regional/global climate shifts characterized over at least a three decade long period. Accordingly, weather changes occurring during a single season or even over a few years in one region don’t validate global climate trending one way or another, much less any measurable human influences.

Consider, for example, that Icelandic Vikings raised livestock in grasslands on Greenland’s southwestern coast as recently as 1,000 years ago. These Norse settlements were then abandoned by about 1350 — after temperatures dropped. Temperatures dropped dramatically again in the middle of the 16th century. The end of this time witnessed brutal winter temperatures suffered by Washington’s troops at Valley Forge in 1777-78, and Napoleon’s bitterly cold retreat from Russia in 1812.

Although temperatures and weather conditions have been generally mild over about the past 150 years, the past century has witnessed two periods of warming. The first occurred between 1910 and 1945 when CO2 levels were relatively low, compared with now.

The second warming which followed a full climate cycle cool-down began in 1975. Global mean temperatures rose at quite a constant rate until 1998, a strong Pacific Ocean El Niño year. Satellite records show that since then, and despite rising atmospheric CO2 levels, temperatures have been statistically flat over the past 18 years and counting.

Consider that less than a half-climate cycle after the planet had experienced a full cooling cycle, the U.N. Intergovernmental Panel on Climate Change (IPCC) and Al Gore’s minions already determined that human fossil-fueled CO2 emissions had put the world at tipping point crisis. Then, after Mother Nature intervened to suggest otherwise, the story changed. Global warming not only became re-termed climate change — now it even caused global cooling. And yes, as a matter of fact, U.S. winters have been getting colder over the past 20 years.

Still, according to the IPCC, “Milder winter temperatures will decrease heavy snowstorms.” As recently as last month, Environmental Protection Agency (EPA) Administrator Gina McCarthy teamed with the Aspen Skiing Co. and a pair of Olympic snowboarders at the "X Games" to put out the message that reduced snow due to climate change would ruin the ski industry. Yet according to a snow report website, “Current snowpack levels are at 165 percent of average” for Aspen.

On the other hand, haven’t global warming activists been warning us that since warmer air adds more moisture, snow storms will become worse? As the Center for American Progress headed by former Obama White House adviser/Clean Power Plan proponent John Podesta claimed, “climate change may have affected the [recent Boston] snow storm — may have made it more likely, may have made it worse than it would have been without so much greenhouse gas in the atmosphere.” Incidentally, this very same John Podesta will most likely head Hillary’s 2016 presidential campaign.

Besides, given that U.S. winter temperatures are actually colder, how does this warmist argument explain record snow and ice? At the same time that Connecticut experienced the coldest February in recorded history, nearby Boston amassed a near record 101.8 inches of snow.

Meanwhile, ice breakers had to open pathways through the Hudson River to keep ships moving. New England lobster boats became frozen in ports for weeks. And on Jan. 27, Canadian adventurer Will Gadd, using ice picks, became the first person ever to scale Niagara Falls which had frozen solid.

So if some of us have come to suspect that we’re witnessing a feverish snow job, does this really qualify us as climate change deniers? Golly, this is all so confusing. It’s enough to give anyone attempting to keep track of the changing story cold sweats.

Larry Bell is an endowed professor of space architecture at the University of Houston where he founded the Sasakawa International Center for Space Architecture (SICSA) and the graduate program in space architecture. He is author of “Climate of Corruption: Politics and Power Behind the Global Warming Hoax,” and his professional aerospace work has been featured on the History Channel and the Discovery Channel-Canada. Read more of his reports — Click Here Now.


© 2015 Newsmax. All rights reserved.
 
Before I go any further with this, let me be very clear that neither I nor anyone I know doubts that climate changes. This has been going on throughout our planet’s history — beginning long before the Industrial Revolution introduced smokestacks and SUVs.
He is author of “Climate of Corruption: Politics and Power Behind the Global Warming Hoax,”

What nonsense ... typical from the climate change denial half wits.
http://www.desmogblog.com/larry-bell pal of Fred Singer....

bullshit_detector4.gif
 
Last edited by a moderator:
"...climate change denial half wits." So any one who disagrees with you in any way is a half wit, in your opinion? I think this thread has reached the end of its run, in MY opinion.
 
Oh, no. I don't think we're done here.

More and more scientific "half-wits" (or any number of ad hominems from GLG) are coming forward with discoveries that question the alarmist position.

For instance: A Basic Model of the Greenhouse Effect with Climate Sensitivity=0.2 C
http://claesjohnson.blogspot.ca/2015/03/a-basic-model-of-greenhouse-effect-with.html

Basic model.jpg

Model of an Earth-atmosphere system absorbing energy from the Sun, which is partially transferred to the ground surface thermodynamically and emitted to outer space partially from the ground through an "atmopsheric window" and partially from the atmospher. The effect of "closing the window" is at most 2 C.

The standard basic model of the Earth's energy budget predicts a "total greenhouse effect" of 33 C as the difference between the presently observed global Earth surface temperature of + 15 C and a projected temperature of - 18 C of an Earth with fully transparent atmosphere without any "greenhouse gas".

The projection of - 18 C results from a direct application Stefan-Boltzmann's law as the temperature of a blackbody (or grey body) at the same distance to the Sun as the Earth.

This model is extremely simplistic but yet is used as a starting point for projections of alarming global warming from small changes in the radiative properties of the atmosphere by human emsission of CO2. A 10% change of a "total greenhouse effect" of 33 C is presently sending an alarm of 3 C propagated to humanity by IPCC.

Following Einstein one should always seek a model which is as simple as possible, but not too simple. Viewing the above 1-stage model as too simple, we consider instead the following 3-stage model of an Earth-atmosphere system "without greenhouse gas effect":
1.Radiative absorption of 240 W/m2 out of incoming 340 W/m2 from the Sun with absorptivity 0.7 by Earth+atmosphere system.
2.Thermodynamic transfer of 240 W/m2 from Earth+atmosphere to Earth ground surface (without loss).
3.Radiative emission of 240 W/m2 from ground directly to outer space through "fully open atmospheric window" with emissivity 0.7 at 280 K = 7 C according to Stefan-Boltzmann 240=0.7×σ280 4 with σ=5.67×10 −8 Wm −2 K −4 .
We compare with present observation of ground temperature of 15 C with emission of 40 W/m2 directly from the ground to outer space, with thus "1/6-open atmospheric window".

Extrapolation to fully closed window, then predicts a ground temperature of 15+ 8/5 C, say 17 C.

The total effect of closing the present atmospheric window of 40 W/m2 by massive emission of a greenhouse gas, thus could at most cause a warming of 2 C.

We have thus with a less simplistic model arrived at a "total greenhouse effect" of 2 C instead of the 33 C by the too simple model.

Incidently, this connects to the so-called "2-degree goal", but now with the 2 C as the maximally possible "total greenhouse effect", with thus 10% changes of size 0.2 C as an upper estimate of climate sensitivity as global warming by doubled CO2. Reducing 33 C to 2 C reduces global warming alarm to nothing.

The maximal change of global temperature under varying radiative properties of the atmosphere including clouds and "greenhouse gasses", could thus be estimated to at most 2 C. This conforms to the observed temperature variation during the last 10.000 years after the last ice age.

Note that the crucial element in the not-too-simple model is the thermodynamic step 2 separating emission from absorption resulting in a double reduction with absorptivity=emissivity= 0.7, to be compared with one reduction with absorptivity=emissivity in the too simple model.
 
Status
Not open for further replies.
Back
Top