spring time
Well-Known Member
ok guys what do you run for electronic charts navionics or c-map.
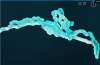
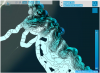
") I attached some comparisons from the Navionics Webapp for my maps in Wilby area and for the north side of Grant's Reef which I just started mapping towards the end of the summer. I really like with Insight Genesis how you can also track bottom hardness. Just my .02 cents.
I attached some comparisons from the Navionics Webapp for my maps in Wilby area and for the north side of Grant's Reef which I just started mapping towards the end of the summer. I really like with Insight Genesis how you can also track bottom hardness. Just my .02 cents.I use a Navionics chip but have been steadily mapping areas that I fish regularly with Lowrance's Insight Genesis. It is remarkably more detailed and accurate. I think I uploaded 97 maps last summer just on Wilby Shoal/Green/Red can area. It would be nice if others started doing the same
ok guys what do you run for electronic charts navionics or c-map.
Have you compared your Insight charts with the Navionics Sonar Chart? Might be a more apples to apples comparison?I use a Navionics chip but have been steadily mapping areas that I fish regularly with Lowrance's Insight Genesis. It is remarkably more detailed and accurate. I think I uploaded 97 maps last summer just on Wilby Shoal/Green/Red can area. It would be nice if others started doing the same
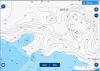
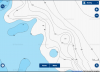
Yes I have, I get that the WebApp is far less detailed but it was all I could do for a comparison. Making a map in Insight Genesis is as accurate as it gets. I have found several areas where Navionics shows a specific contour that doesn't actually exist and visa versa. The problem is that it takes time to make. I actually find it kind of facinating making the maps and analyzing them after. Each pass over a certain area adds detail. If more people subscribed to the practice we'd all be further ahead. Take for example on the NE corner of Wilby Shoals, Navionics shows kind of an underwater island which shows in a blue circle. Well that just doesn't exist, its a peninsula. What it does is with extreme accuracy to be able to troll a specific contour. By this time next year, I plan to have the entire area of the Green/Red can mapped as well as start on Kitty Coleman are.Have you compared your Insight charts with the Navionics Sonar Chart? Might be a more apples to apples comparison?
Yes I have, I get that the WebApp is far less detailed but it was all I could do for a comparison. Making a map in Insight Genesis is as accurate as it gets. I have found several areas where Navionics shows a specific contour that doesn't actually exist and visa versa. The problem is that it takes time to make. I actually find it kind of facinating making the maps and analyzing them after. Each pass over a certain area adds detail. If more people subscribed to the practice we'd all be further ahead. Take for example on the NE corner of Wilby Shoals, Navionics shows kind of an underwater island which shows in a blue circle. Well that just doesn't exist, its a peninsula. What it does is with extreme accuracy to be able to troll a specific contour. By this time next year, I plan to have the entire area of the Green/Red can mapped as well as start on Kitty Coleman are.
I am struggling with the choice as well, YouTube shows some big time comparison differences between the two. I have always used Navionics, but I am really liking what I see with Cmaps Genisis
Im pretty sure its not possible to use both. I wish people in my areas- French creek would start to use it that would make my choice way easier.